 AWS
 Azure
 Google Cloud
In one sentence: log ingestion is billed per byte on the way in, so a debug level left on or a chatty new source costs the same whether anyone reads it or not, and shorter retention does not undo it.
Symptom
The logging line of the bill jumps while traffic stays flat. Ingested bytes per day step up overnight, usually after a deploy, an incident or a new diagnostic setting, and one log group, table or resource type carries most of the increase.
How it happens
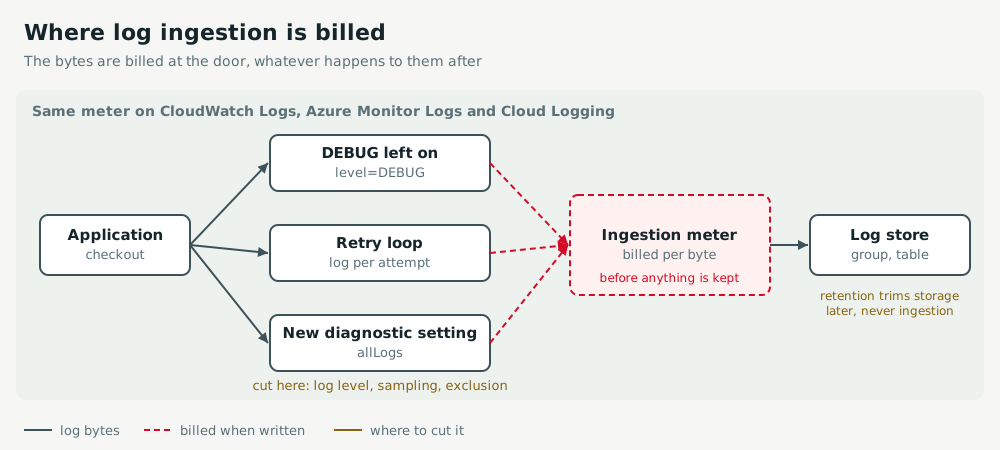
- The meter sits at the door: every byte is billed when it lands. Retention, archive tiers and queries come later and do not refund it.
- Typical sources:
DEBUGleft on after an incident, a retry loop that logs each attempt, health checks logged per request, a diagnostic category enabled with "all logs". - Find the top source by bytes first, then cut it where it is produced: log level, sampling, exclusion. Cut retention only for storage.
Act
AWS
Rank log groups by the IncomingBytes metric of the AWS/Logs namespace with the metric math below. For a Lambda function, set the level in its logging config instead of redeploying code. Log groups that are only kept for audit can be created with the INFREQUENT_ACCESS class, which ingests at a lower rate.
SORT(SEARCH('{AWS/Logs,LogGroupName} MetricName="IncomingBytes"', 'Sum', 3600), SUM, DESC)
aws lambda update-function-configuration --function-name checkout \
  --logging-config LogFormat=JSON,ApplicationLogLevel=WARN,SystemLogLevel=WARN
Azure
Query the workspace's Usage table to rank billable tables. Trim the diagnostic setting that feeds the top table to the categories you use, move verbose tables to the Basic plan, and set a daily cap as a backstop, knowing it drops data once reached.
Usage | where TimeGenerated > ago(1d) and IsBillable == true
| summarize GB = sum(Quantity) / 1000 by DataType | sort by GB desc
az monitor log-analytics workspace update -g rg-obs -n law-prod --quota 20
Google Cloud
Chart logging.googleapis.com/billing/bytes_ingested grouped by resource type to find the source. Drop what nobody needs with an exclusion on the _Default sink: excluded entries are not billed. For load balancers, lower the logging sample rate rather than logging every request.
gcloud logging sinks update _Default \
  --add-exclusion=name=drop-debug,filter='severity<INFO'
Keep watch
AWS
Alarm with anomaly detection on IncomingBytes for the account and for the top log groups. Prove the fix: the hourly sum for the noisy group falls back to its baseline after the change.
Azure
A log search alert on the Usage query above fires when a table exceeds its usual daily volume. Prove the fix: the top table's billable volume falls the next day, with no daily cap hit.
Google Cloud
Alert on billing/bytes_ingested per resource type. Prove the fix: gcloud logging read 'severity<INFO' --freshness=1h --limit=5 returns nothing, because excluded entries are never stored.
Exercise
Bring a log bill back in line, with the clock running: Log storage costs keep climbing.
Related: Audit logging of data access.